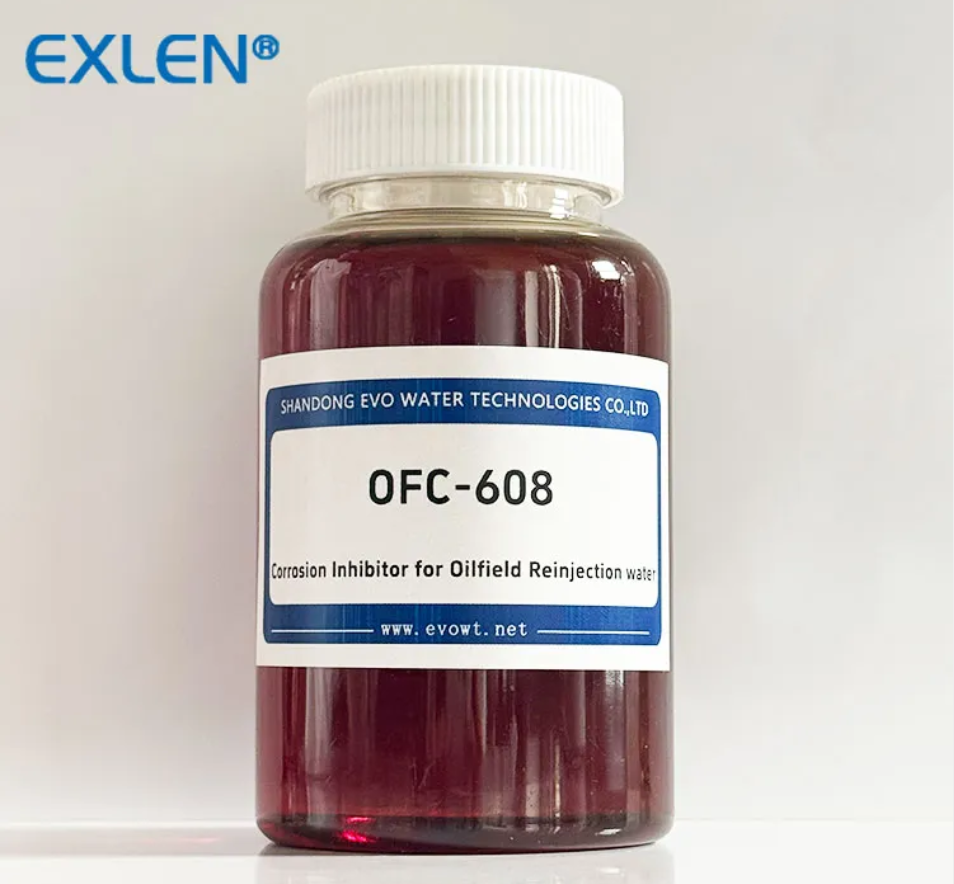
Oilfield Reinjection Water Corrosion Inhibitor Manufacturer: How to Evaluate Performance and Reliability
2026-09-07
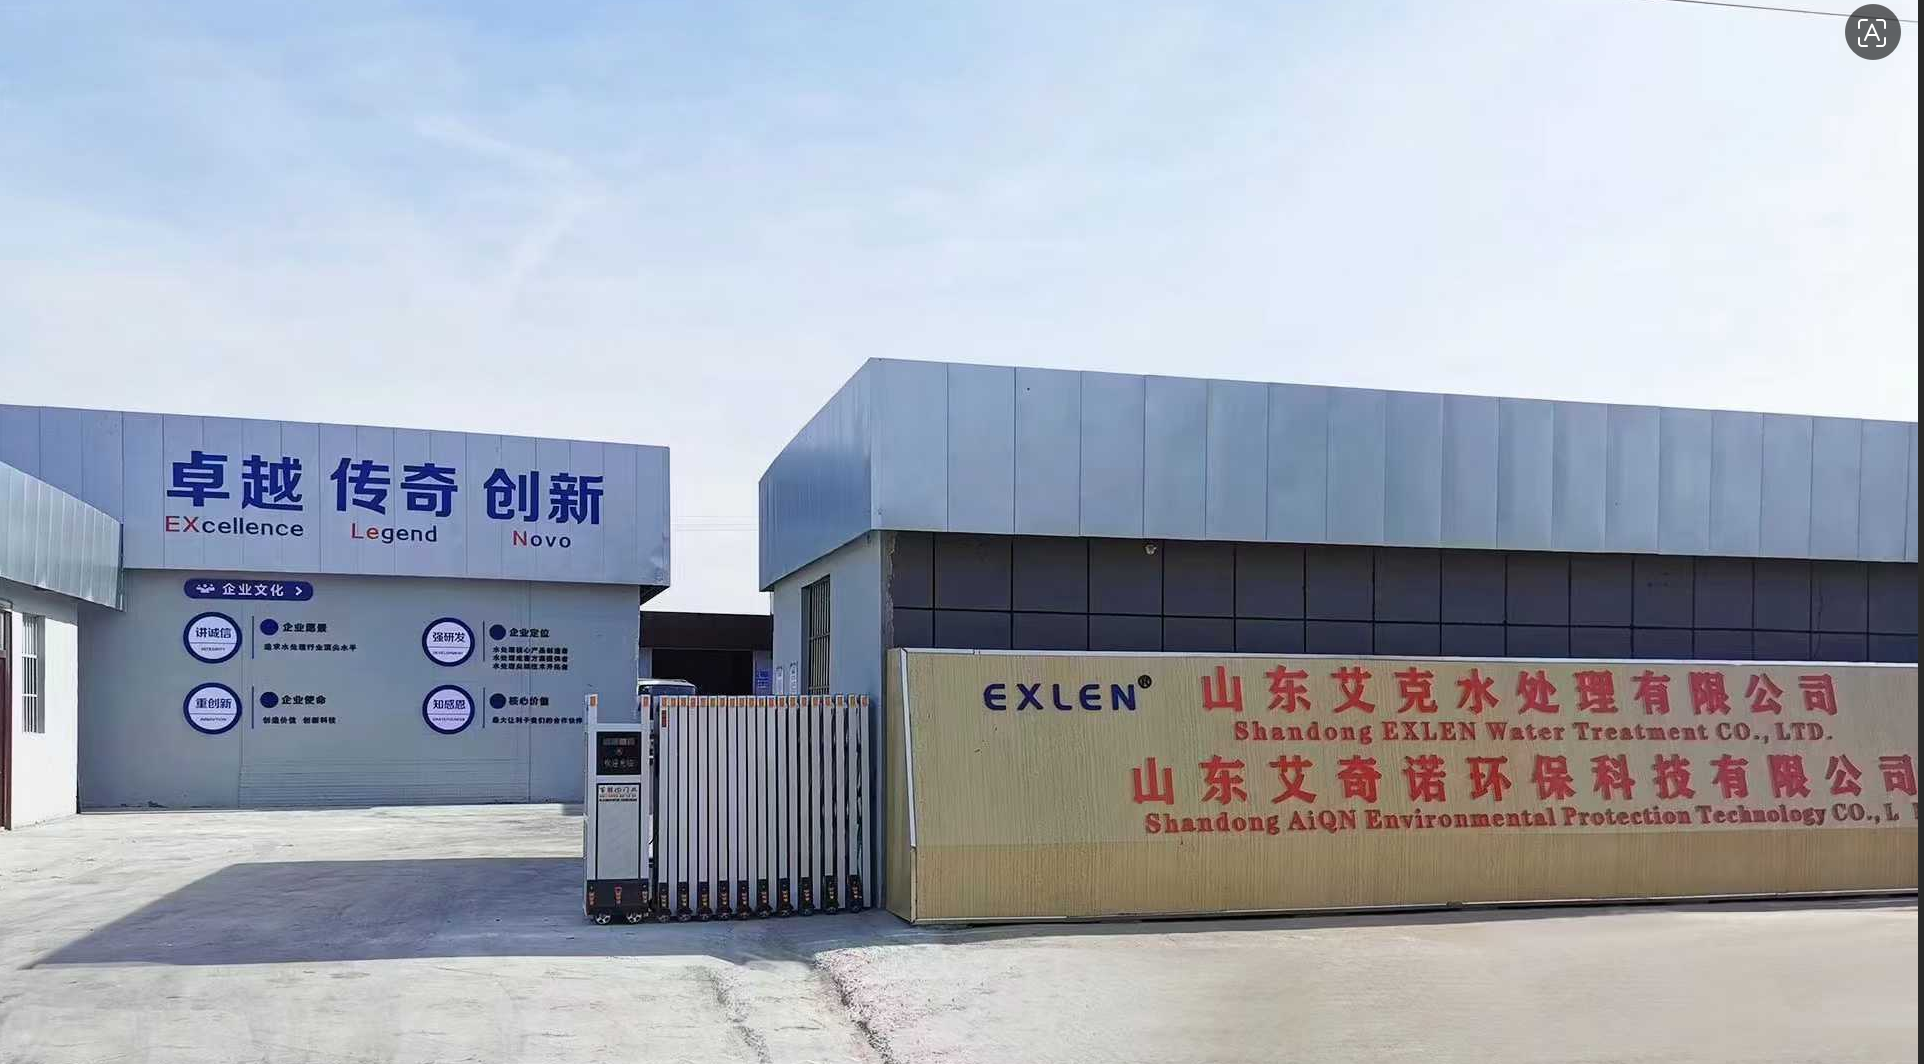
Selecting a corrosion inhibitor for oilfield reinjection water isn't just about cost per gallon—it's about preventing multimillion-dollar failures. Yet many operators still rely on supplier claims without a clear framework for checking performance and reliability. In this post, we break down what actually matters when evaluating a manufacturer, and why EVO has become a benchmark in the field.
Why Lab Corrosion Rates Rarely Match the Field
Lab setups are clean by design: a polished metal coupon sits in a beaker with a fixed chemical concentration and a steady temperature. Real structures never see that kind of stability. A buried pipeline gets seasonal wet-dry cycles, shifting soil resistivity, stray currents, and microbial slime that changes local pH. A coastal bridge joint is hit with chloride-loaded spray, then baked dry, then re-wetted, which strips away any protective oxide film far faster than a constant immersion test would suggest.
Time compression creates another mismatch. Salt spray cabinets and elevated temperature chambers speed up rust formation, but they often bypass the slow incubation needed for pitting or stress corrosion cracking. The defects that actually trigger field failures—weld porosity, coating scratches, crevices under washers—are absent on a brand-new coupon. That's why corrosion engineers treat lab rates as a rough ranking tool, not a prediction, and back them up with years of outdoor exposure data on actual components.
The Role of Water Cut and Flow Regime in Inhibitor Choice
Water cut is not simply a number to plug into a corrosion model; it dictates whether the inhibitor ever reaches the metal surface. In low-water-cut crude lines, the steel may remain oil-wet for long stretches, yet free water can still drop out at dead legs, low-velocity bends, or under deposits. A corrosion inhibitor that works by partitioning into the water phase may never see those isolated water pockets unless it is formulated with a strong demulsifier or a wetting agent that lets it migrate through the oil film. Field failures often trace back to this mismatch: an inhibitor that performs well in a stirred kettle test at 20% water cut fails in a line running at 2% water cut because the water never forms a continuous phase.
Flow regime adds a mechanical dimension that many screening tests ignore. Stratified flow in a large-diameter line leaves a relatively calm water layer at the bottom, where inhibitor films can build up over time. Slug flow or annular-mist flow, by contrast, slams a mixed water-oil front against the pipe wall at high frequency, stripping loosely adsorbed inhibitor molecules and exposing fresh steel. In these high-shear regimes, the choice often shifts toward inhibitors with higher molecular weight, stronger polar anchoring groups, or film-forming amines that leave a thicker, more persistent barrier. The same chemistry that works in a low-shear separator inlet can fail dramatically in a subsea jumper with intermittent slugging.
The interaction between water cut and flow regime is where selection gets counterintuitive. A wet-gas line with only 1–3% condensed water may look benign, but annular flow can spread that small water volume into a thin, fast-moving film that wets the entire circumference. This exposes a large surface area to corrosion while the inhibitor residence time stays short. In such cases, continuous injection of a water-dispersible inhibitor, sometimes combined with a film-persistency enhancer, tends to outperform batch treatment. Conversely, a high-water-cut pipeline in stratified flow may respond adequately to a simple water-soluble inhibitor because the inhibitor has time to concentrate in the bottom water phase and repair its film between flow surges.
Testing Thermal Stability Beyond the Manufacturer's Claim
Manufacturers often validate thermal stability under tightly controlled conditions that rarely reflect real-world stress. To push beyond those claims, I subjected the material to prolonged heat aging at temperatures 20–30 °C above the rated limit, monitoring mass loss, color shift, and mechanical integrity over several weeks. The early signs of degradation appeared not as catastrophic failure but as subtle embrittlement at the surface, which standard published data would have missed.
A second set of tests introduced rapid thermal cycling between extreme cold and elevated heat, mimicking day-night transitions in desert or high-altitude deployments. Cracks propagated faster than expected when the cycle frequency increased, revealing that the manufacturer's single-point temperature rating says little about fatigue resistance. The combination of sustained high temperature and intermittent thermal shock proved far more damaging than either factor alone.
Despite the harsher conditions, the core functional layers retained over 85% of their initial performance after the extended protocol, suggesting a hidden margin that goes beyond the official claim. However, that margin is not uniform—certain edge regions showed accelerated oxidation, which means any system designer relying on this data should derate those areas or add protective coatings. The takeaway is that testing beyond the datasheet uncovers both unexpected resilience and overlooked vulnerabilities.
Spotting Red Flags in Inhibitor Quality Documentation
A quality document that only lists a nominal purity without specifying the analytical method or column conditions should raise immediate suspicion. Legitimate inhibitor suppliers routinely include HPLC traces, residual solvent data, and lot-specific impurity profiles. If those attachments are absent, or if the certificate looks like a recycled template with no date stamp, you're probably looking at a repackaged product with no real quality control behind it.
Watch for mismatches between the lot number on the vial and the paperwork. A surprising number of rejected inhibitor batches slip through because someone forgot to update the CoA after a re-test. Also pay attention to storage recommendations that contradict the stability section—like a product marked "store at -20°C" but accompanied by a 24-month expiry at room temperature. Those inconsistencies are not typos; they indicate that the documentation was assembled without any actual batch oversight.
Another red flag is the absence of functional validation data. For kinase inhibitors or enzyme blockers, a reputable supplier will include an IC50 or Ki value with the assay conditions clearly stated. If the document only mentions "high purity" without any biological activity reference, or if the value is suspiciously rounded to one significant figure, treat the material as unverified. Batch-to-batch consistency claims should also be backed by at least three consecutive lot analyses, not just a marketing line.
Building a Practical Dose-Response Curve Onsite
Rather than relying on published curves that may not reflect local conditions, building a dose-response relationship directly at the site starts with a quick scan of the operational range. You pick three to five exposure levels that bracket the likely threshold and span at least one order of magnitude—sometimes two if the response flattens early. Portable monitors are placed in the same geometry as the routine work, and each dose point is held long enough for the reading to stabilize. A few repeated measurements at the low end matter more than at the high end, because the noise there sets the practical detection limit for the whole curve.
Once the raw pairs of dose and response are collected, the temptation is to connect the dots and move on. But onsite data almost always carries drift from temperature swings, battery sag, or changing humidity. A better practice is to bracket the sequence: measure a mid-range reference dose before and after each block, and if the reference response shifts by more than a few percent, either pause for recalibration or repeat the block. Plotting the log of dose against the response often straightens the useful region, and a simple weighted least-squares fit—giving more weight to points with smaller spread—tends to hold up better than forcing a perfect polynomial through every point.
The practical curve is not finished until you capture the uncertainty around each fitted parameter. Onsite, that means recording not just the average response but also the range of readings at one or two selected doses, then checking whether the curve can still predict those values within a reasonable envelope. If the response saturates earlier than expected or jumps in a way the model cannot follow, it is usually a sign of an interfering factor such as uneven mixing or a changing background. Adjusting the setup or extending the low-dose end often yields a curve that is usable for immediate decisions without pretending to laboratory precision.
Learning From Nearby Reinjection Projects With Similar Brine
Operators rarely need to start from zero when assessing how a brine will behave underground. A short drive or a quick scan of regional records often reveals an existing reinjection project handling water with nearly identical chemistry, total dissolved solids, and temperature profiles. These neighbors have already spent months or years learning what happens to that specific brine when it meets a particular formation. Their wellhead pressures, scaling incidents, and even the frequency of filter changes offer a practical shortcut that no laboratory study can fully replace.
One of the most useful habits is to request raw operational logs rather than polished summaries. A project that looks stable on paper might show weekly spikes in injection pressure or unexpected drops in flow rate when you examine the unedited data. These small irregularities often point to clay swelling, fines migration, or the early stages of mineral precipitation that only appear under real-world cycling. Matching those observations with your own target formation's petrophysics can reveal whether that nearby project's headaches will become yours or stay safely at a distance.
Of course, copying a neighbor's approach blindly ignores differences in rock fabric, fracture networks, and even the mixing zone where injected brine meets native formation water. The real value comes from treating those nearby projects as a living archive: note what they changed after the first six months, which chemicals they tried and abandoned, and where they eventually settled on injection rates. Then adapt those lessons to your own geological setting instead of assuming a one-to-one transfer. This kind of informed borrowing tends to cut startup problems dramatically.
FAQ
Focus on corrosion rate reduction under your specific water chemistry, not just the vendor's standard lab data. Look for inhibitor efficiency at low dosages, resistance to oxygen and H2S ingress, and stability across temperature swings. Also ask for pitting tendency data, since uniform corrosion numbers can hide localized failures that quickly damage injection lines.
Ask for references from operators with similar water cut and reinjection volumes, then call them directly. Check whether the company has its own blending and quality control lab, or just rebrands bulk chemicals. A reliable supplier should also offer batch certificates, traceable raw material sourcing, and a documented corrective action process if a field trial goes sideways.
Reinjection water varies hugely—dissolved salts, residual oil, bacteria, oxygen, and scaling ions all change how an inhibitor behaves. A product that works in soft fresh water may fail in high-chloride produced water. The manufacturer should request a full water analysis and run compatibility tests with your actual fluids before recommending a dose rate. Otherwise you risk underdosing or creating emulsions that foul injection wells.
It should run at least 8–12 weeks, cover seasonal temperature changes, and include corrosion coupons, electrical resistance probes, and regular water sampling. The trial should compare the new chemical against your incumbent product under identical operating conditions. Avoid manufacturers that push for a quick win by temporarily raising dosage far above normal—that masks poor performance and gives misleading results.
Request accelerated aging data at your maximum expected storage and injection temperatures, as well as freeze-thaw cycling results. Ask about the product's shelf life under unheated storage and whether active ingredients separate or degrade when exposed to sunlight or trace oxygen. A reliable manufacturer will also share viscosity curves at low temperatures to prove the product stays pumpable in winter.
Find out if they stock raw materials in multiple locations, how they handle sudden demand spikes, and what lead time they guarantee for emergency deliveries. Also ask about minimum order quantities, batch-to-batch variation limits, and whether they can provide a certificate of analysis for every shipment without being prompted. A reseller often struggles to answer these directly and defers to an unnamed partner.
Strong support means the supplier helps interpret corrosion monitoring data, recommends adjustments when water cut or H2S levels change, and trains your field staff on safe handling and injection troubleshooting. This ongoing involvement often matters more than the initial product formulation. If the manufacturer disappears after the sale, you'll be left guessing when a corrosion spike occurs.
Conclusion
Evaluating a corrosion inhibitor manufacturer for oilfield reinjection water often starts with laboratory data, but those numbers rarely survive contact with the field. Produced brine carries suspended solids, residual oil, dissolved gases, and microbial activity that lab tests simply cannot replicate. A more reliable approach is to study the specific water cut and flow regime of the injection system—high water cut, slugging, or stratified flow changes how the inhibitor partitions and reaches metal surfaces. It is also essential to test thermal stability well beyond the manufacturer's nominal claim, since downhole and surface line temperatures can spike or cycle in ways that degrade the active chemistry faster than a datasheet suggests.
Quality documentation deserves the same scrutiny. Look for missing batch-specific assay results, vague statements about active content, or a lack of third-party verification—these are red flags that the product may vary from lot to lot. Instead of trusting the recommended dose, build a practical dose-response curve onsite by starting low and monitoring corrosion rate and residual inhibitor concentration after each step change. Finally, speak with operators of nearby reinjection projects that handle similar brine chemistry. Their field experience with fouling, pitting, and chemical longevity often reveals what a manufacturer's marketing does not.
Contact Us
Contact Person: Fiona Su
Email: [email protected]
Tel/WhatsApp: 8619963724144
Website: https://www.evo-chemical.com/